Product vision · UX/UI Design · TRR · UX designer for the area, with the product team
Helping aspiring business owners work out what they need to charge
For someone thinking about starting a business, one of the biggest questions is whether the finances will add up. How much do I need to charge to earn a living?
TRR already had a calculator that could provide the answer, but it was an Excel spreadsheet with multiple tabs, accounting terms and calculations that were difficult to understand without help.
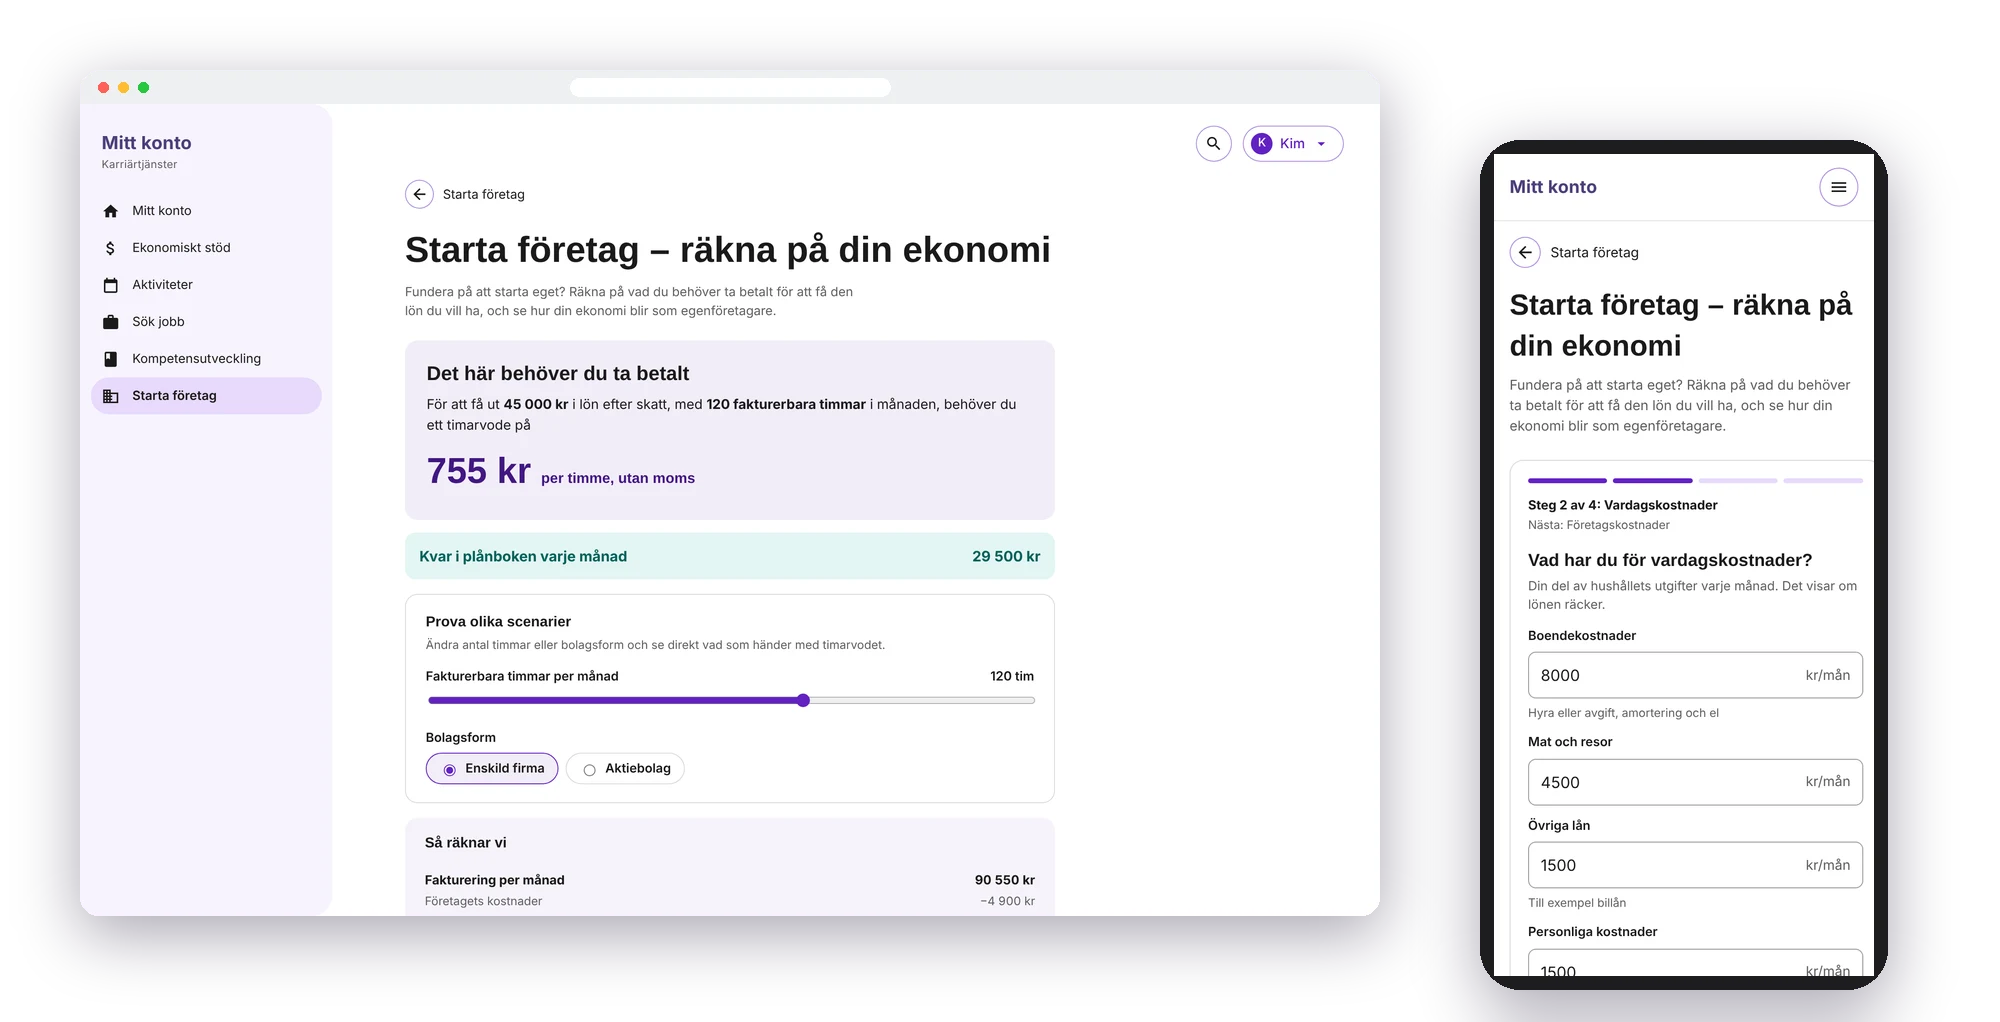
As the UX designer for the Sök jobb and Starta företag area, I redesigned the calculator as a guided digital tool. Instead of beginning with costs and financial calculations, people could start with their own goal: the salary they wanted to take home.
Four questions lead to a clear hourly rate. Users can then change assumptions such as billable hours and company type to explore different scenarios.
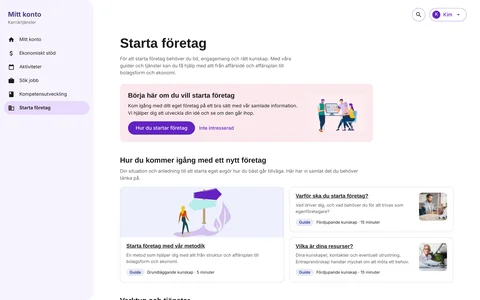
I also designed the Starta företag collection page, bringing guides, tools and services together in one place. Both parts were designed within TRR’s shared product vision to help people take their next step after career transition.
The work progressed from early sketches to development-ready designs. The digital calculator can be explored in a working prototype on desktop and mobile.
- My role
- UX designer for Sök jobb and Starta företag, in the product development team
- Users
- People TRR helps who are thinking of starting their own business
- Company
- TRR
- Area
- Starta företag: collection page, guides and tools
- Platform
- Web, desktop and mobile, logged in and logged out
The short version
The problem
TRR’s support for starting a business was spread across guides, tools and services.
The business calculator could help people work out the hourly rate they needed, but it was an Excel spreadsheet with multiple tabs, accounting terms and numerous fields. It was difficult to know where to start or how to interpret the result.
The challenge was to make the calculation understandable without losing the financial logic it depended on.
My contribution
I designed the Starta företag collection page and transformed the existing Excel calculator into a guided digital self-service tool.
I changed the order of the calculation so users started with their desired take-home salary, and designed a four-question flow with contextual guidance, a clear result and the ability to explore different scenarios.
The work included exploring interaction patterns, prototyping, detailed UX/UI design and preparing development-ready designs.
The result
A connected collection page gave people a clear route to guides, tools and support for starting their own business.
The business calculator became a development-ready digital solution that guides users towards an hourly rate and lets them change their assumptions to compare scenarios.
Designed for both logged-in and logged-out visitors, the solution can be explored in a working prototype on desktop and mobile.
Two paths forward after career transition
Not everyone receiving support from TRR wants to take the same next step. Many look for a new job, while others consider starting their own business.
I was the UX designer for both Sök jobb and Starta företag within the same product team. I developed a shared product vision focused on helping people move from career transition to their next occupation.
One direction, different needs
Someone looking for a job needs support to understand their opportunities, find relevant roles and prepare applications.
Someone considering starting a business needs different kinds of support: understanding what running a business involves, planning the venture and working out whether the finances could be viable.
I wanted both paths to feel like parts of the same service, even though the content and tools were different.
My work on Starta företag
I was responsible for the UX/UI design of two parts:
- The collection pageMaking it easier to find guides, services and tools for people considering starting a business.
- The business calculatorWhere I transformed an existing Excel calculation into a guided digital tool.
I worked on both from early sketches through to development-ready designs, together with the product team.
The collection page gave people a clear starting point. The calculator helped them explore one of their most difficult questions: whether running their own business could provide enough income.
Related case: From product vision to a connected job-search service
Bringing support for starting a business together
Starta företag offered different kinds of support, but visitors needed to understand where to begin.
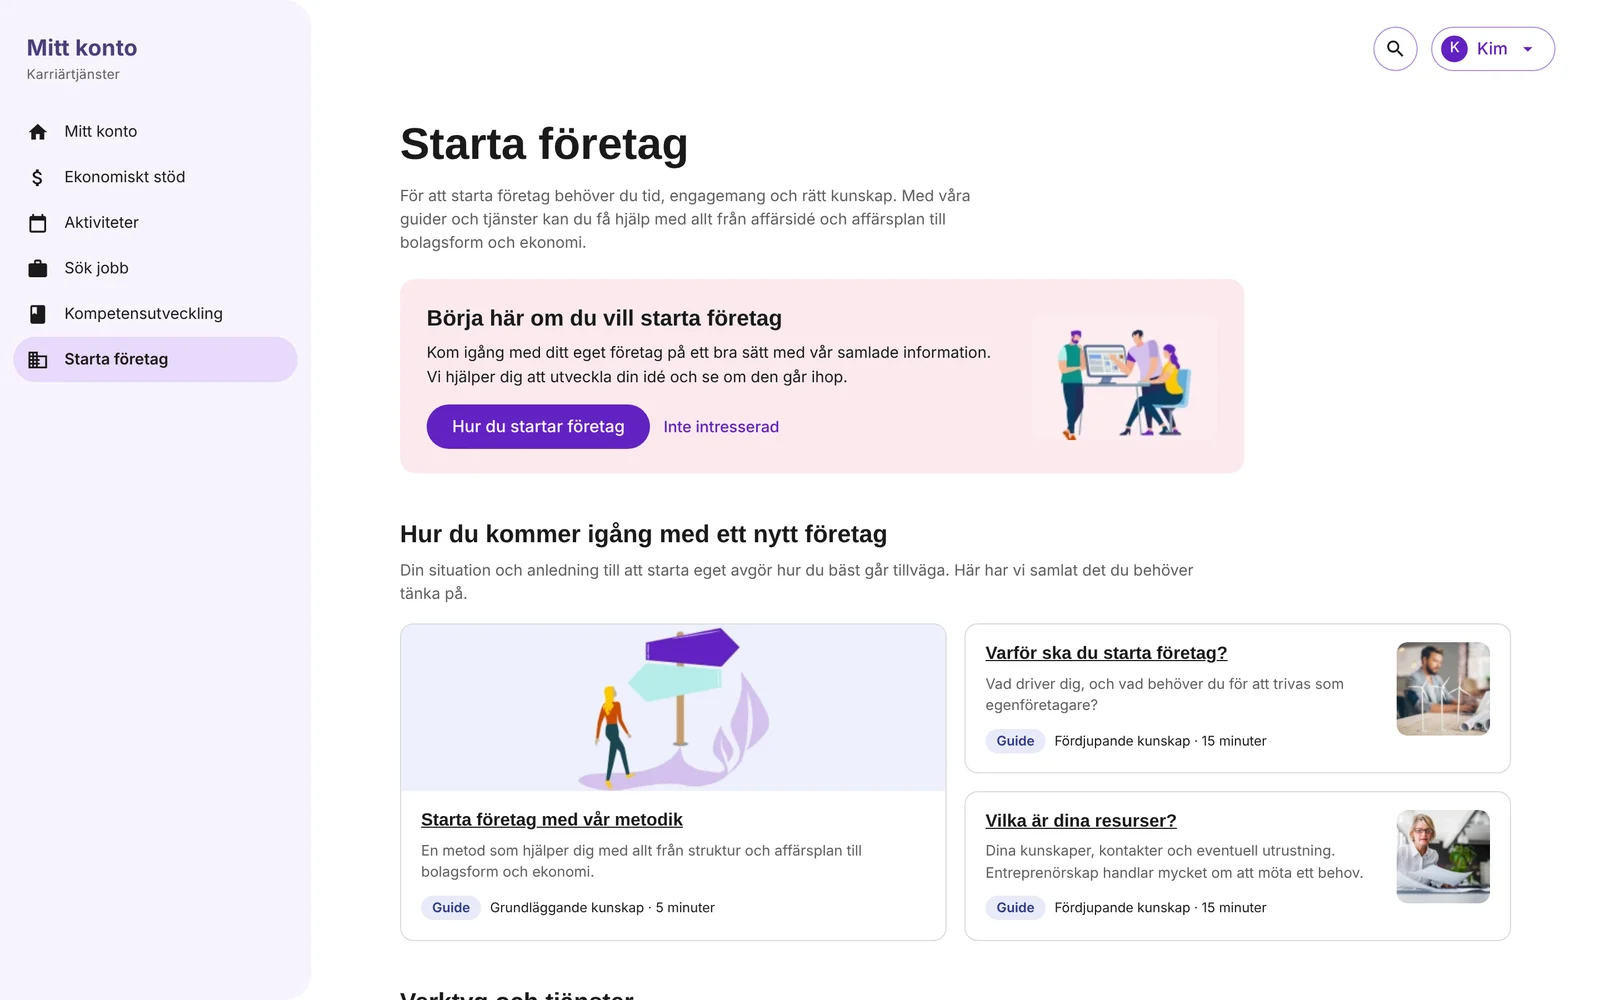
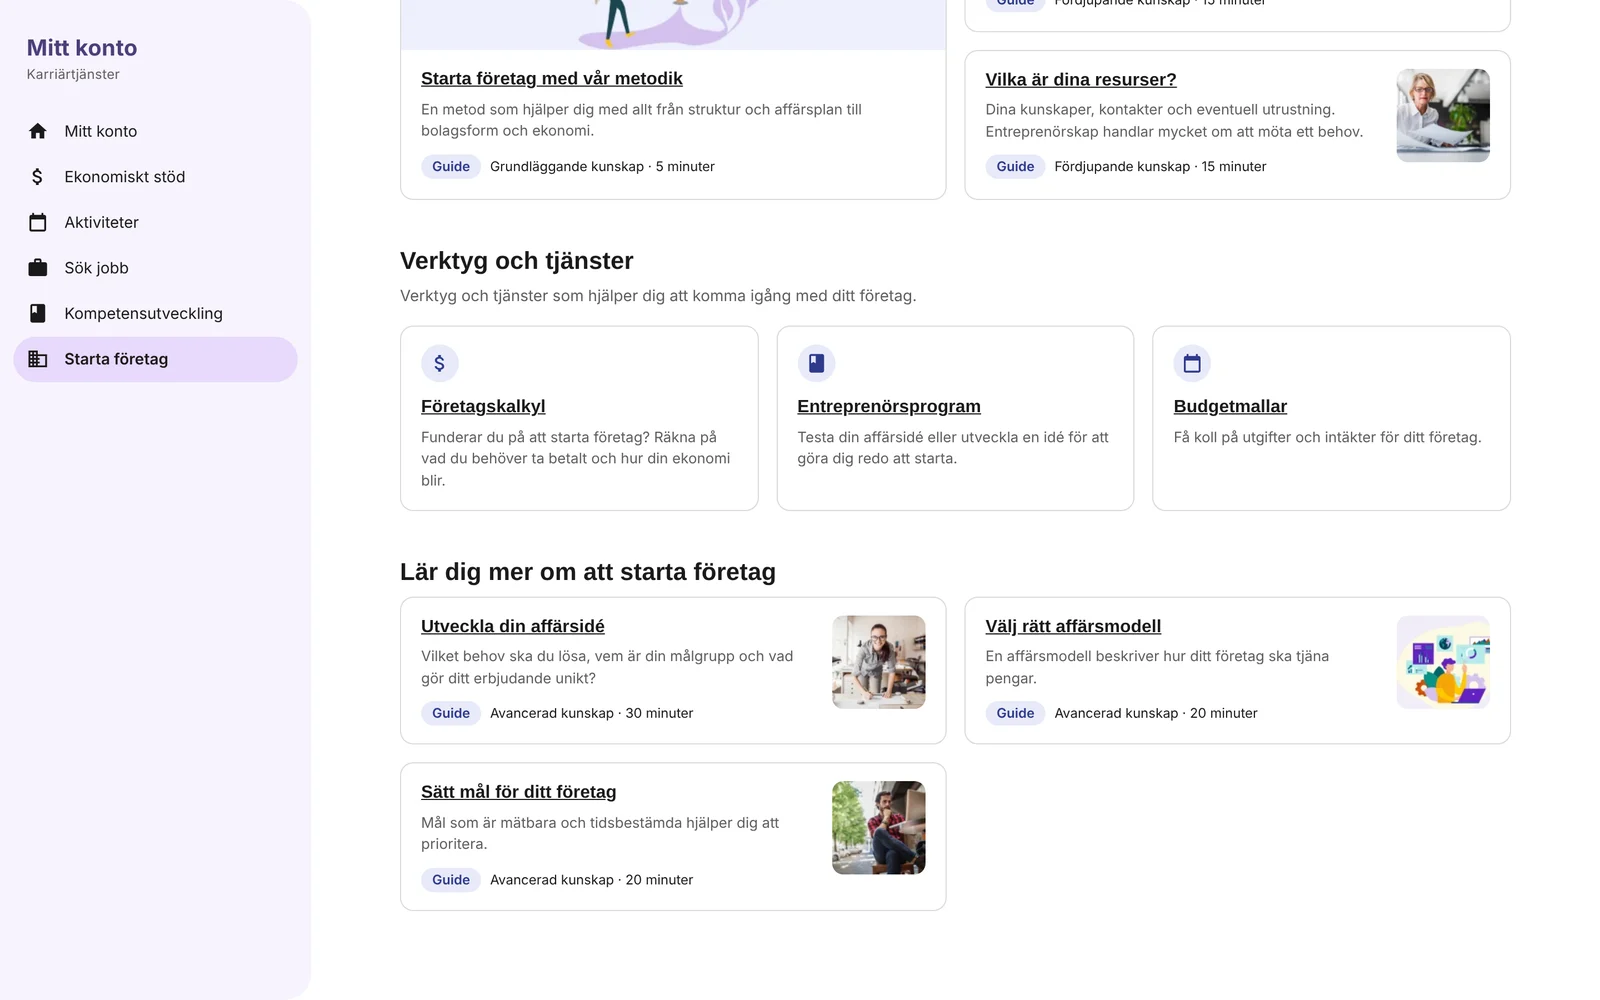
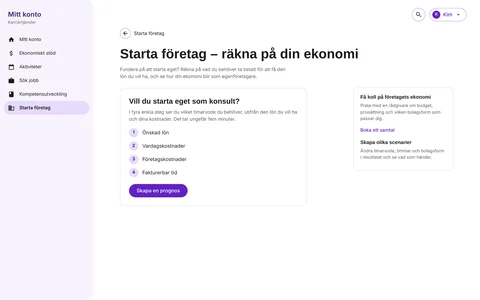
I designed a collection page that gave guides, tools and services a shared structure, using the same components as the Sök jobb collection page.
- Help people find their next stepI placed Börja här (Start here) at the top of the page, providing an entry point based on the person’s situation.
The message can adapt to the user, and they can also indicate that they’re not interested.
The intention was to provide a clear starting point without assuming everyone was at the same stage of planning. - Make guides easier to chooseEach guide shows whether it’s introductory or more in-depth and how long it takes.
This helps people select something that fits both their current knowledge and the time they have available. - Keep practical tools close at handThe business calculator, entrepreneur programme and budget templates were brought together in a dedicated section, close to the guides.
People could move from learning about starting a business to exploring their own situation. - Part of a consistent TRR experienceBy reusing components and structure from Sök jobb, I created a familiar way to find support.
People considering both paths after career transition didn’t have to learn two different ways of navigating the service.
When a spreadsheet got in the way of the answer
One of the most important questions for someone considering self-employment is simple: What do I need to charge to make a living?
TRR already had a tool for working this out. The calculation lived in an Excel spreadsheet covering both sole traders and limited companies.
The financial logic was there. The difficulty was the path users had to follow to reach the answer.
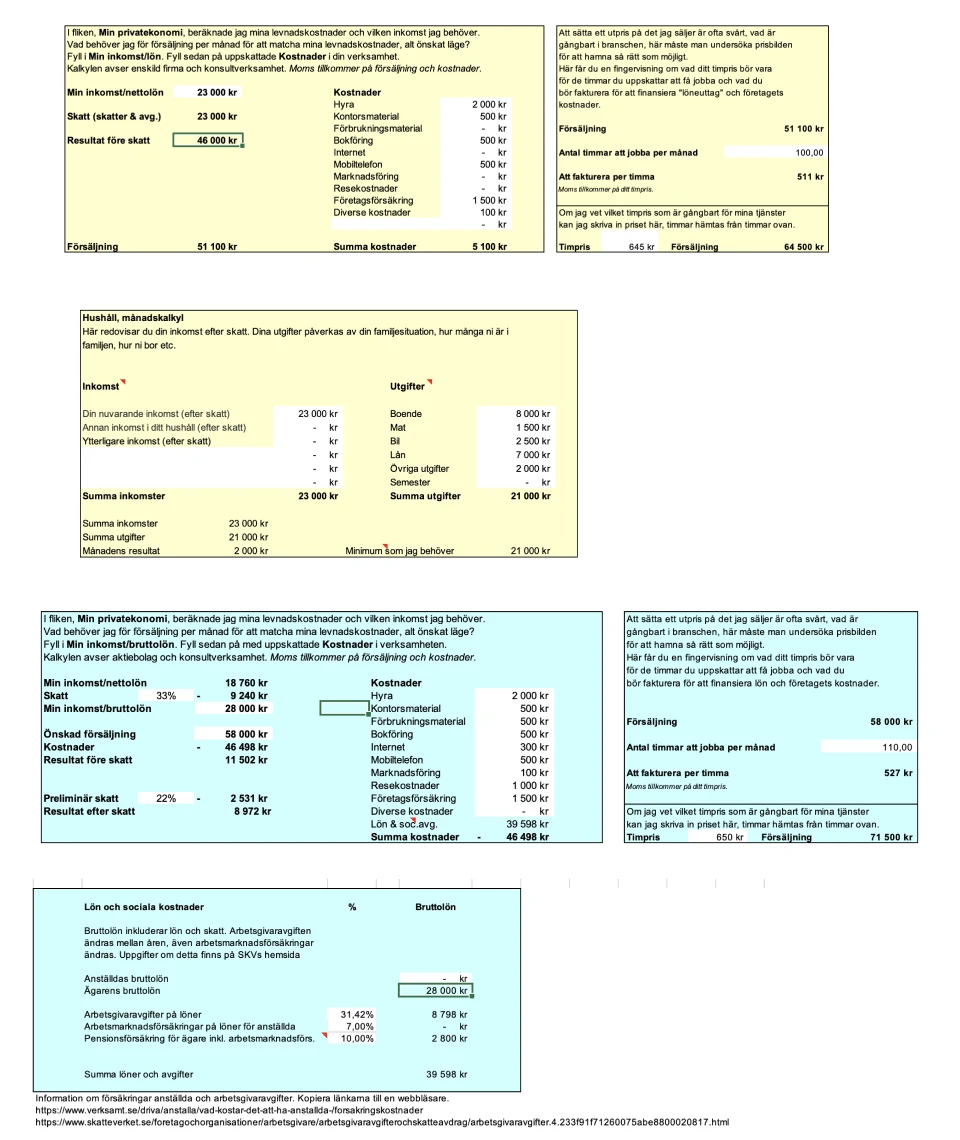
- Many fields, no clear starting pointMultiple tabs, instructions and fields for salary, tax, expenses, sales and working hours made it difficult to know what to enter first.
- Accounting language instead of everyday languageTerms such as profit before tax, gross salary and social contributions mattered to the calculation but could obscure the real question: how much money will I have left, and what do I need to invoice?
- The most important answer came lastThe hourly rate appeared late in a chain of calculations. To reach it, users were expected to understand the structure of the spreadsheet first.
The design challenge
I wanted to make the calculator usable as a self-service tool without an advisor explaining every step. It still needed to account for salary, tax, household expenses, business costs, billable time and the differences between a sole trader and a limited company.
The challenge was to make the calculation easier to use without removing the detail that made it useful.
Making a complex calculation understandable
I didn’t change the underlying purpose of the financial calculation. I changed how people worked through it.
Five design decisions shaped the new business calculator.
- Start with the goal, not the expensesThe Excel spreadsheet built towards an answer through expenses, sales and working hours. I reversed the order.
People begin with the salary they want to take home after tax. The service then helps them provide the information needed to calculate an hourly rate.
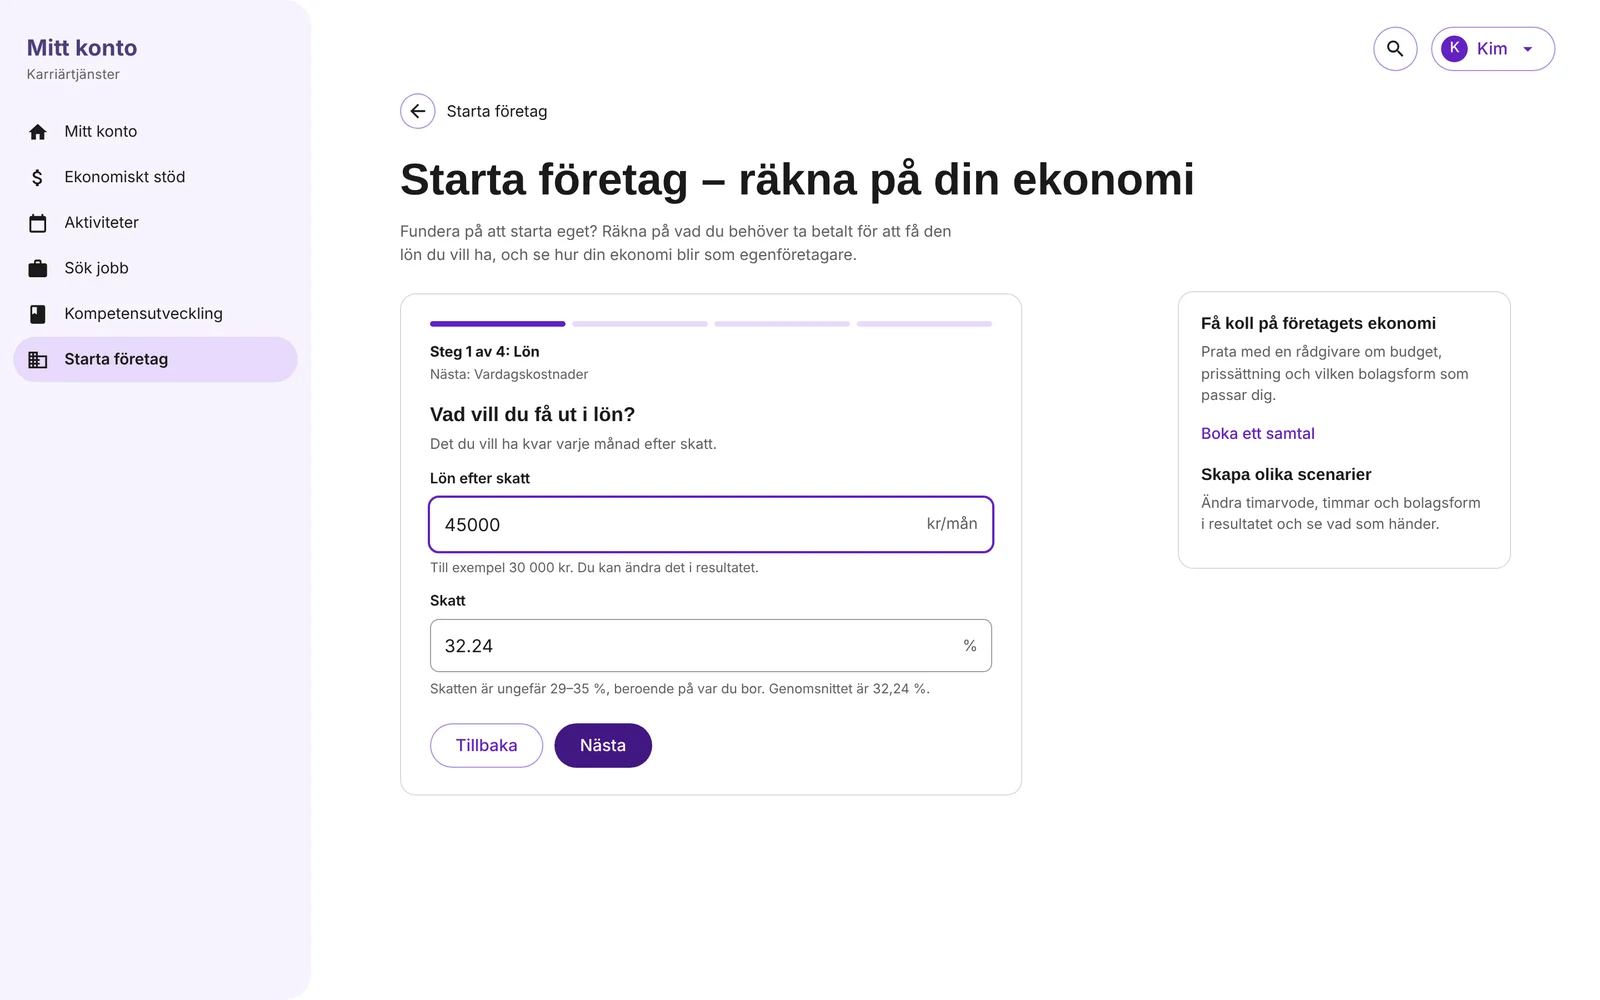
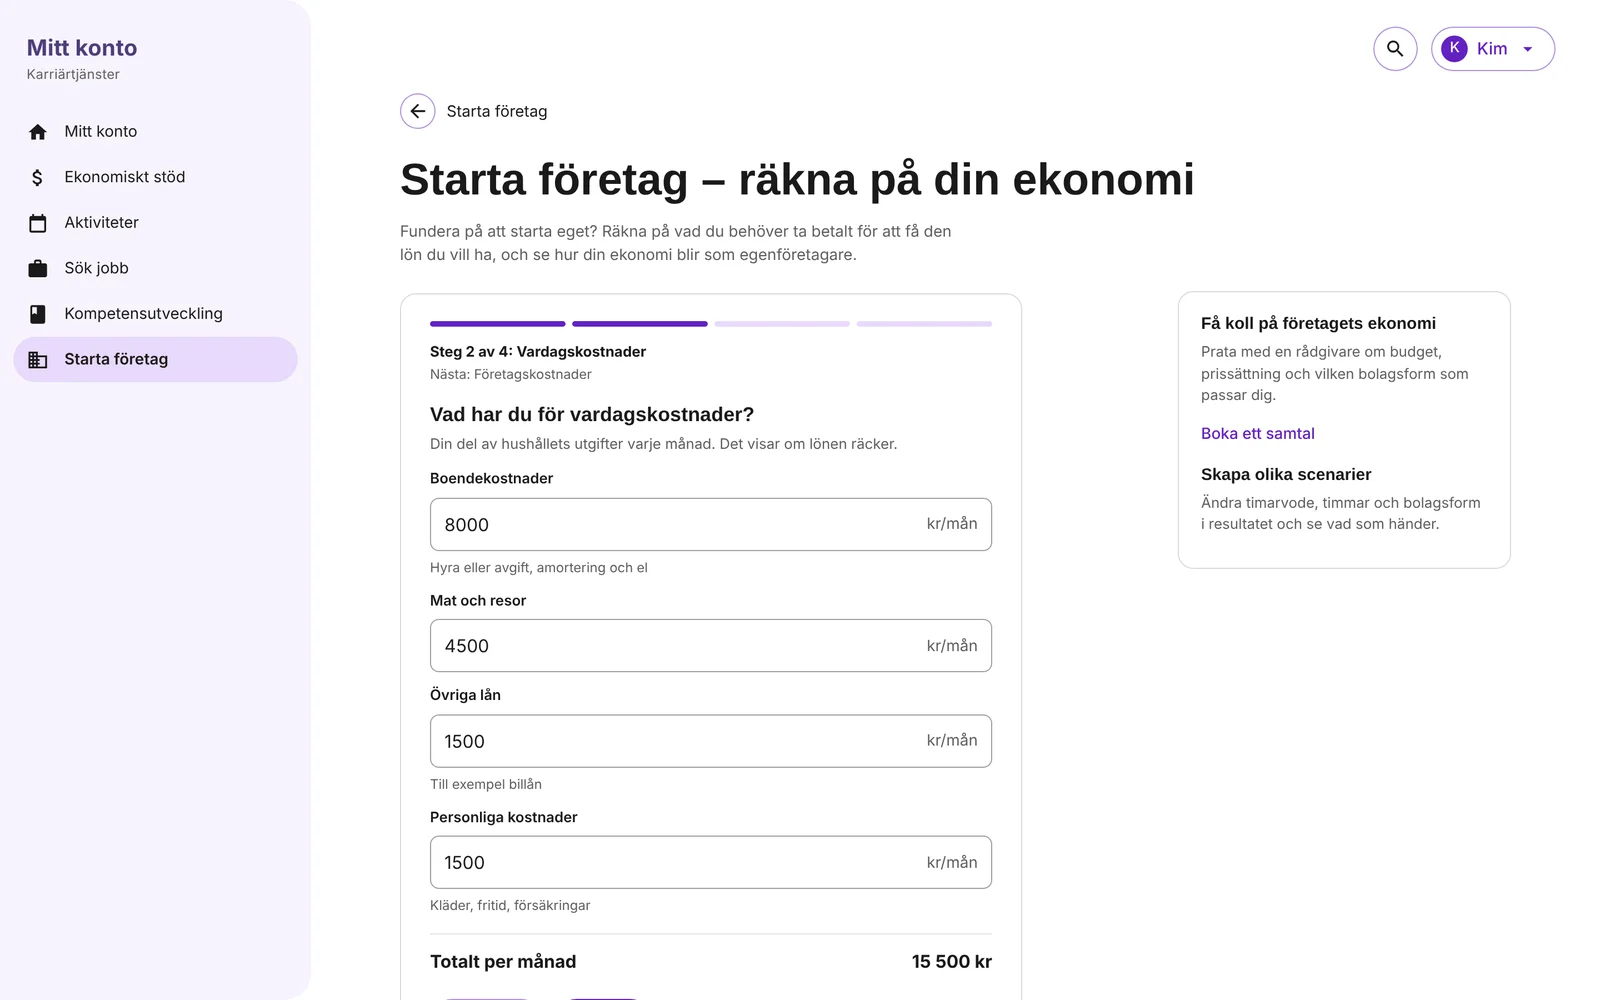
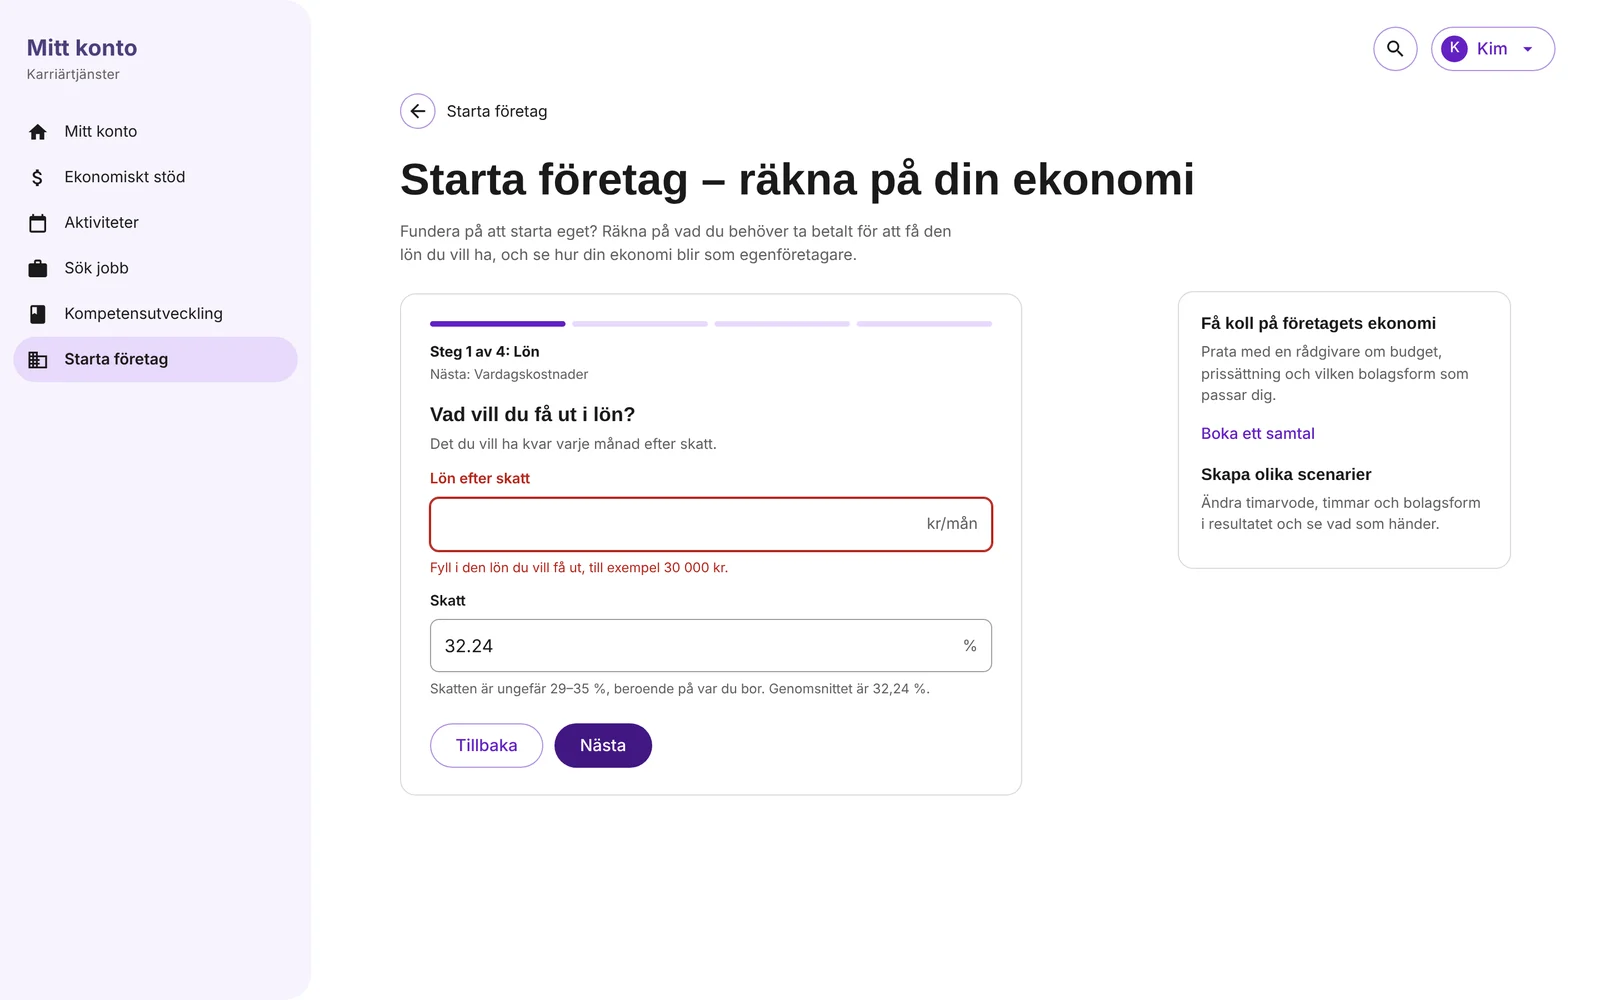
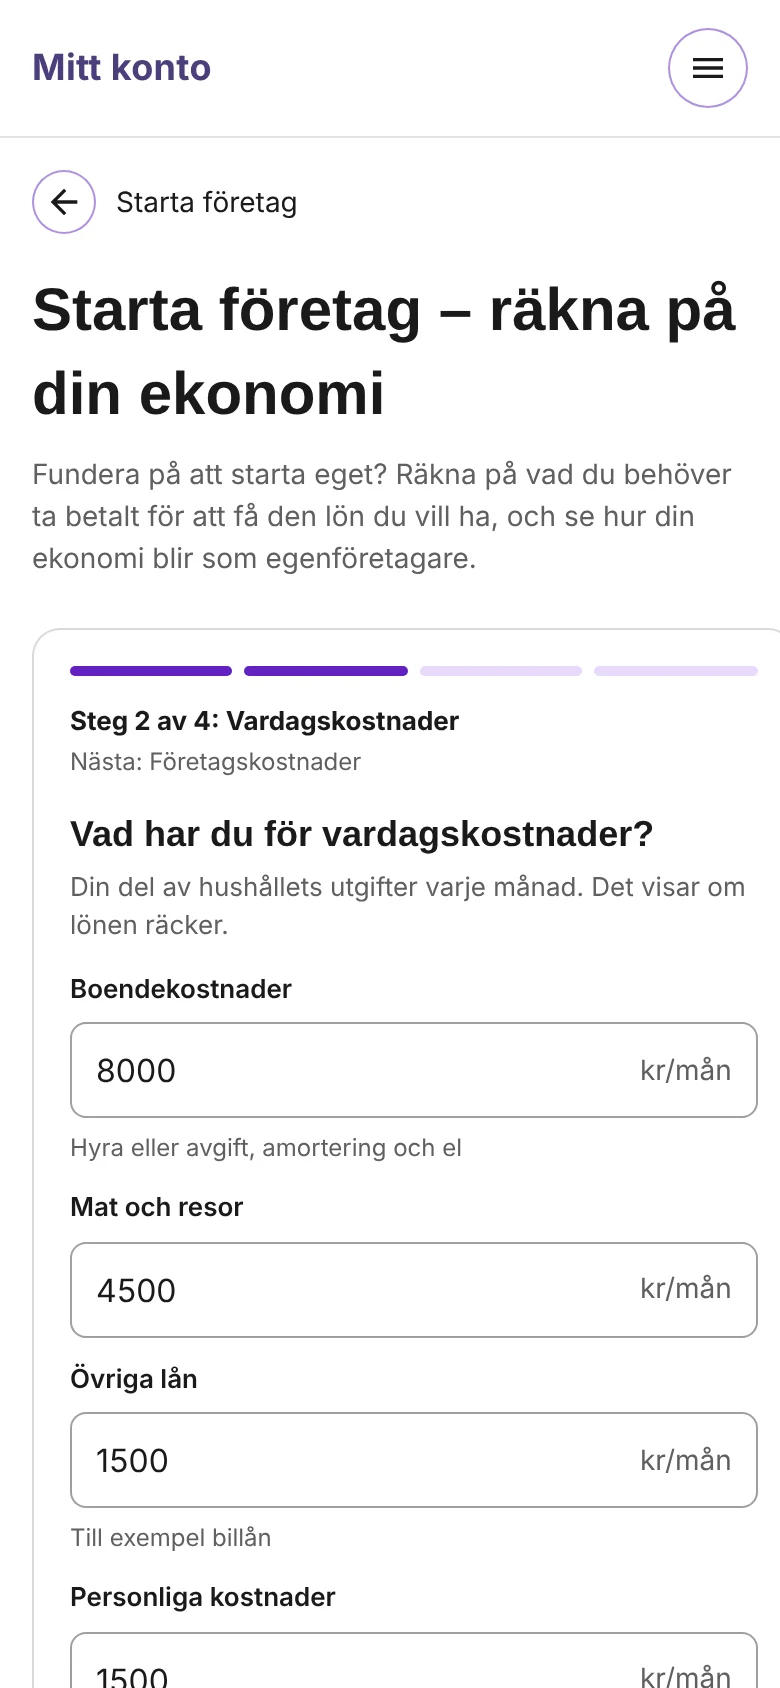
This means the journey starts with a question users can already answer. - Ask one question at a timeI divided the calculator into four short question steps with a progress indicator. Each step uses a clear question in everyday language and shows what remains.
This reduces the amount of information someone needs to understand at once. - Explain things when they’re neededSome questions still require guidance. An average tax rate is prefilled, with a range to provide context.
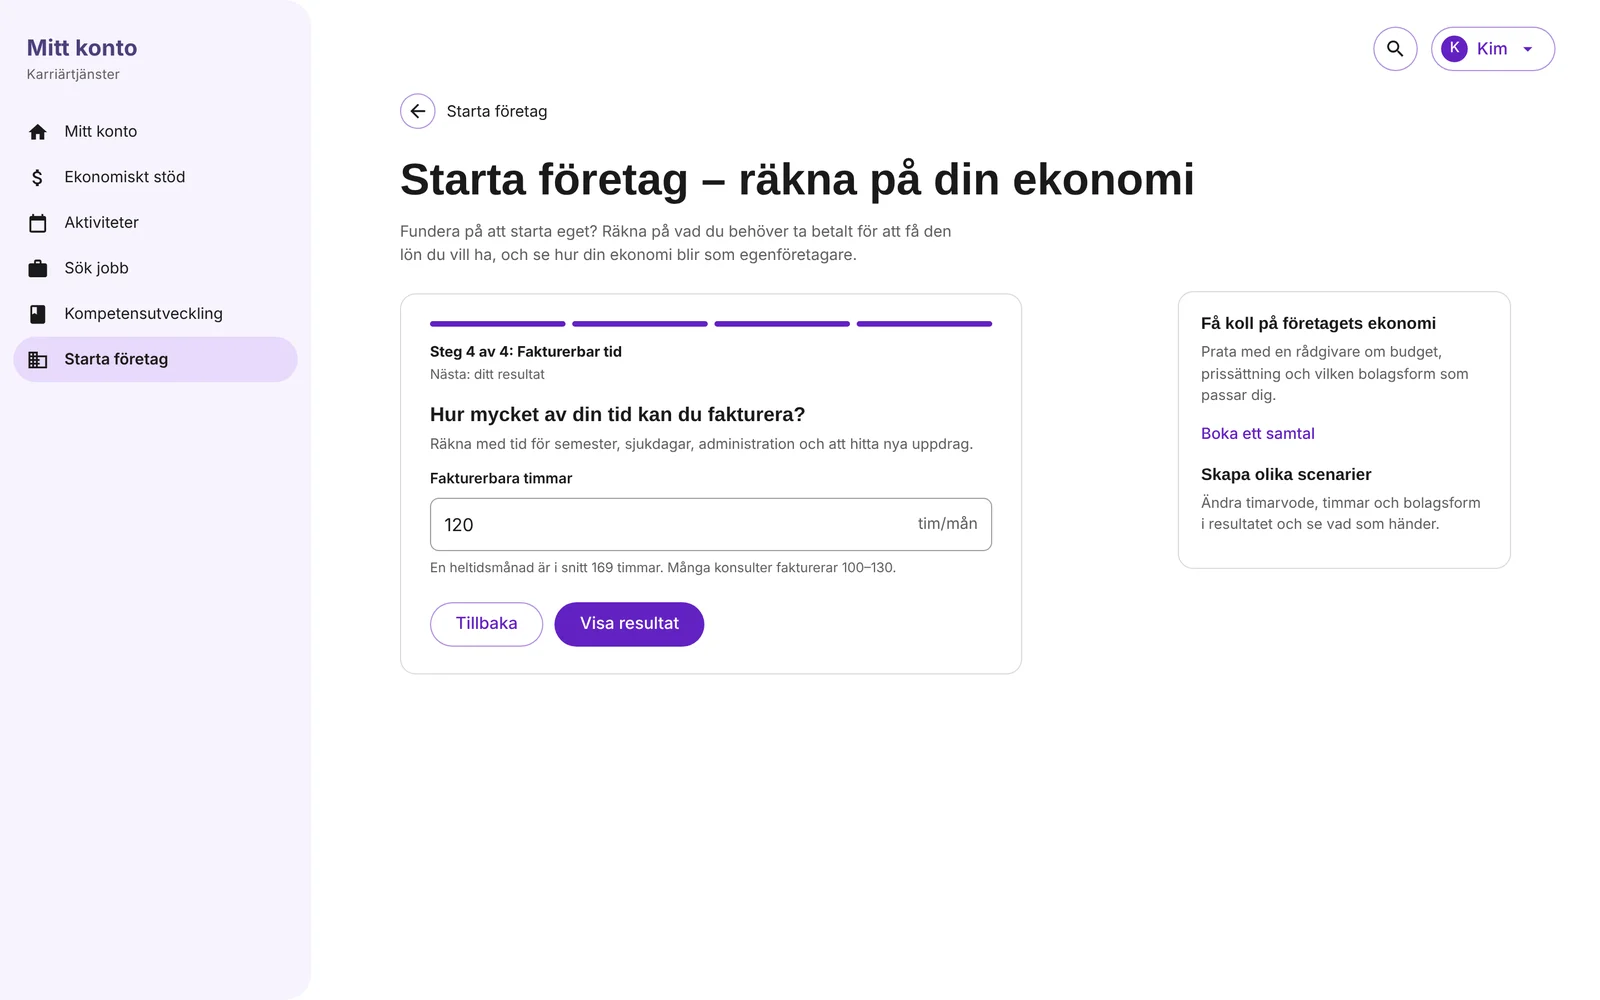
For billable hours, the interface shows a full-time reference point and reminds users that holidays and sick days affect how much time they can actually invoice.
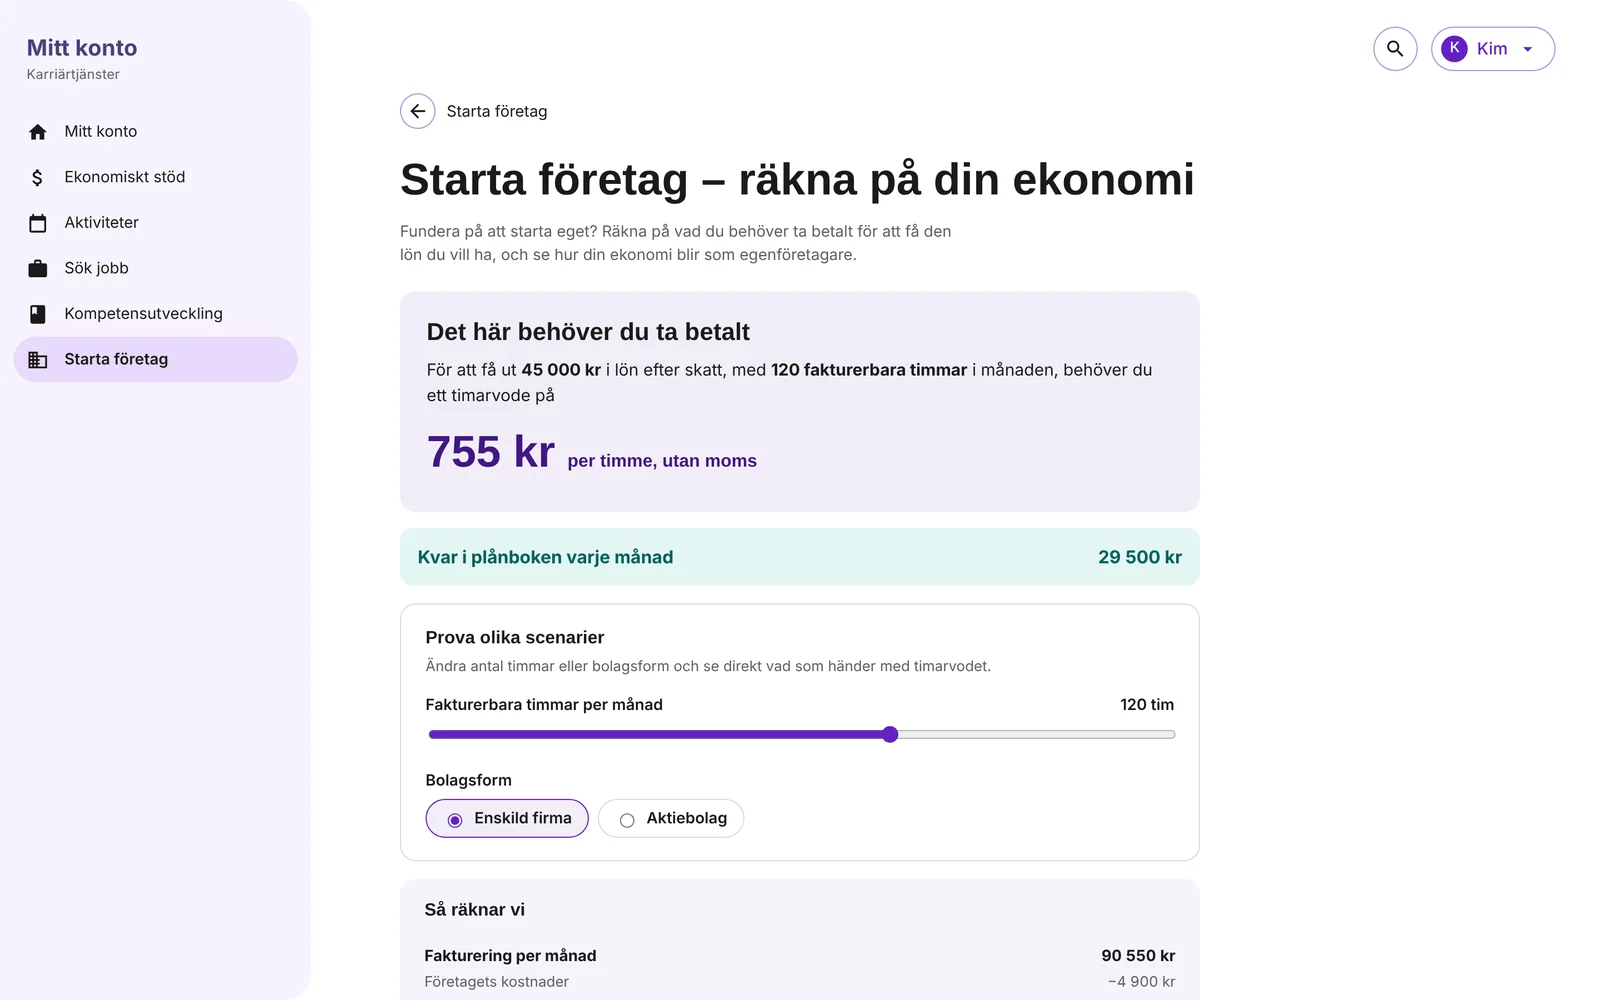
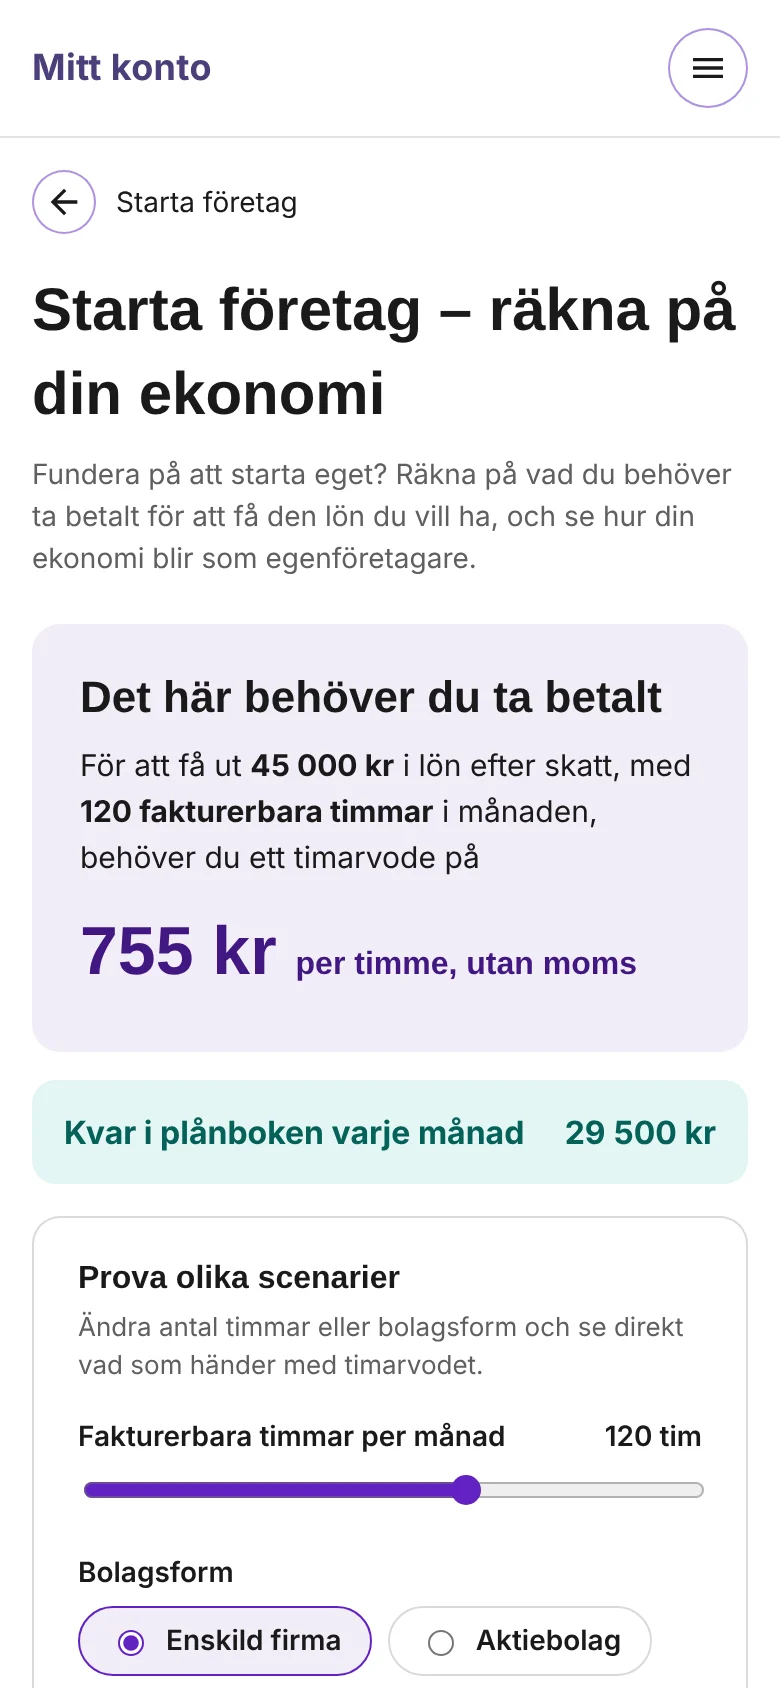
Guidance appears alongside the relevant question, so people don’t have to leave the calculator to work out what’s being asked. - Show the answer first and the explanation afterwardsThe result page leads with what the person came to find out: the hourly rate they need.
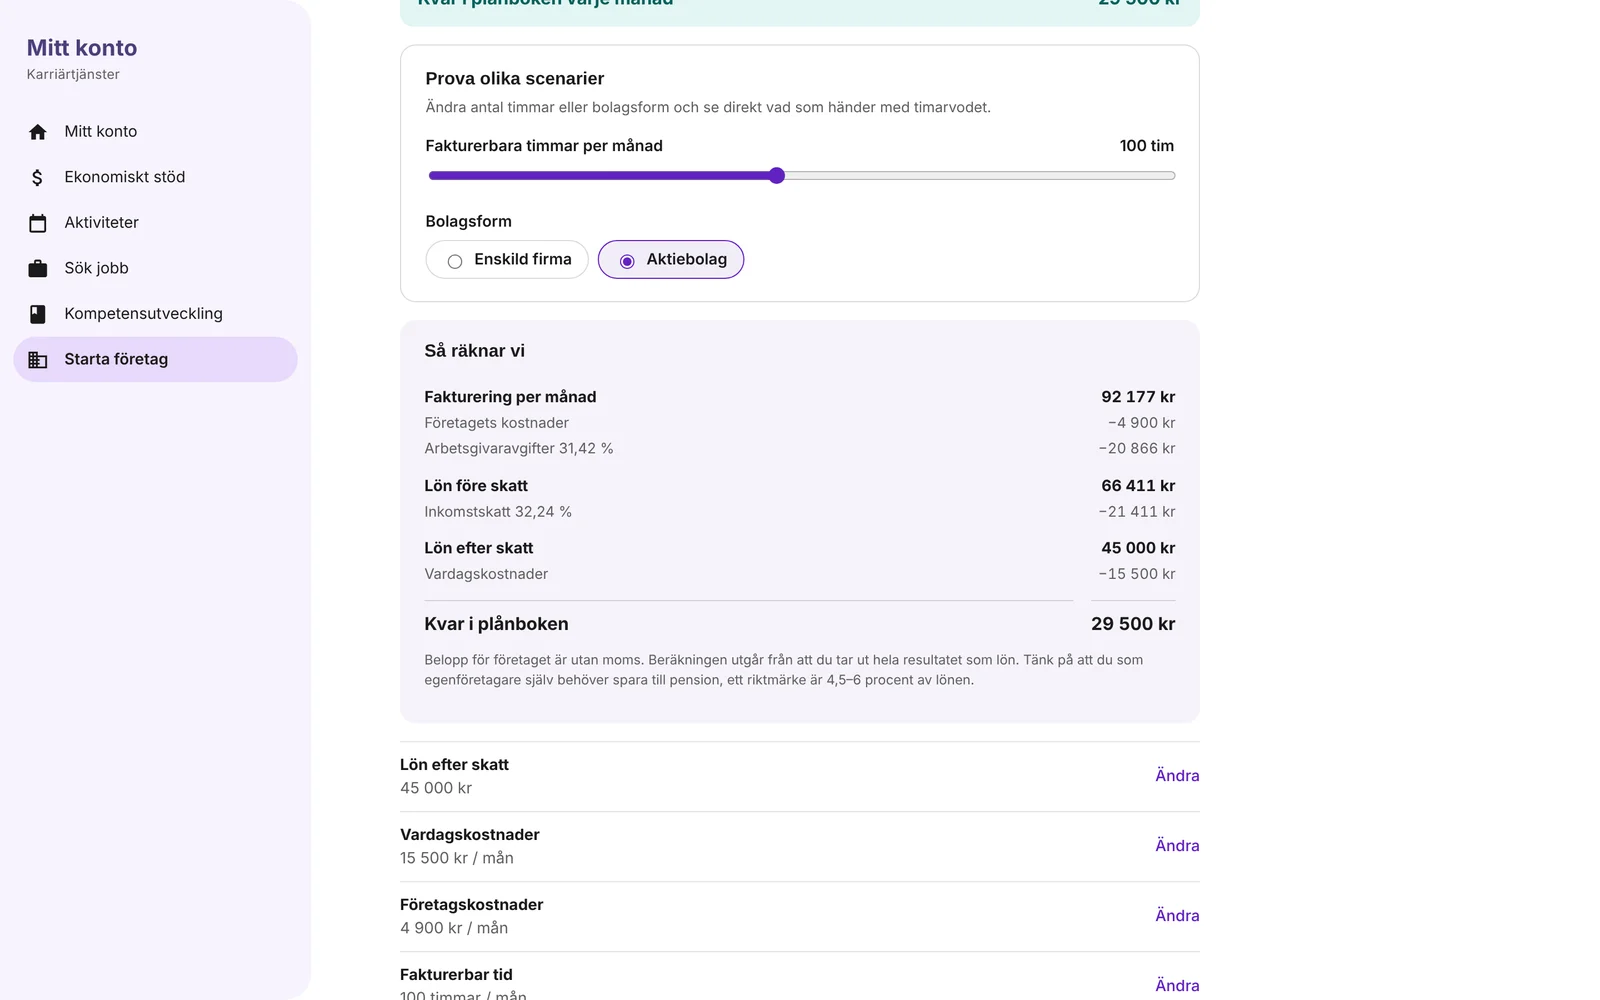
The answer is prominent and reflects the choices they’ve made. The full breakdown remains available further down for anyone who wants to understand how the figures fit together.
This allows people looking for a quick answer and those wanting to check the detail to use the same tool. - Let people explore different scenariosA first answer often leads to more questions. What if I can bill fewer hours? What changes if I run a limited company rather than operate as a sole trader?
On the result page, people can adjust their assumptions and immediately see how the hourly rate and forecast change.
The calculator becomes more than a way to produce a figure. It helps people explore their options.
Two ways to guide people through the questions
I explored two interaction patterns from TRR’s design system.
- Vertical stepperAll steps appear on one page. Answers are shown as people progress, with an option to edit each one.
- Card-based flowOne card presents one question at a time. The flow can sit directly on the Starta företag page, alongside guides and other support.
Both had advantages. The stepper provided an overview, while the cards offered a clearer focus and allowed the calculator to become a natural part of the collection page.
I took the card-based approach forward for the digital design.
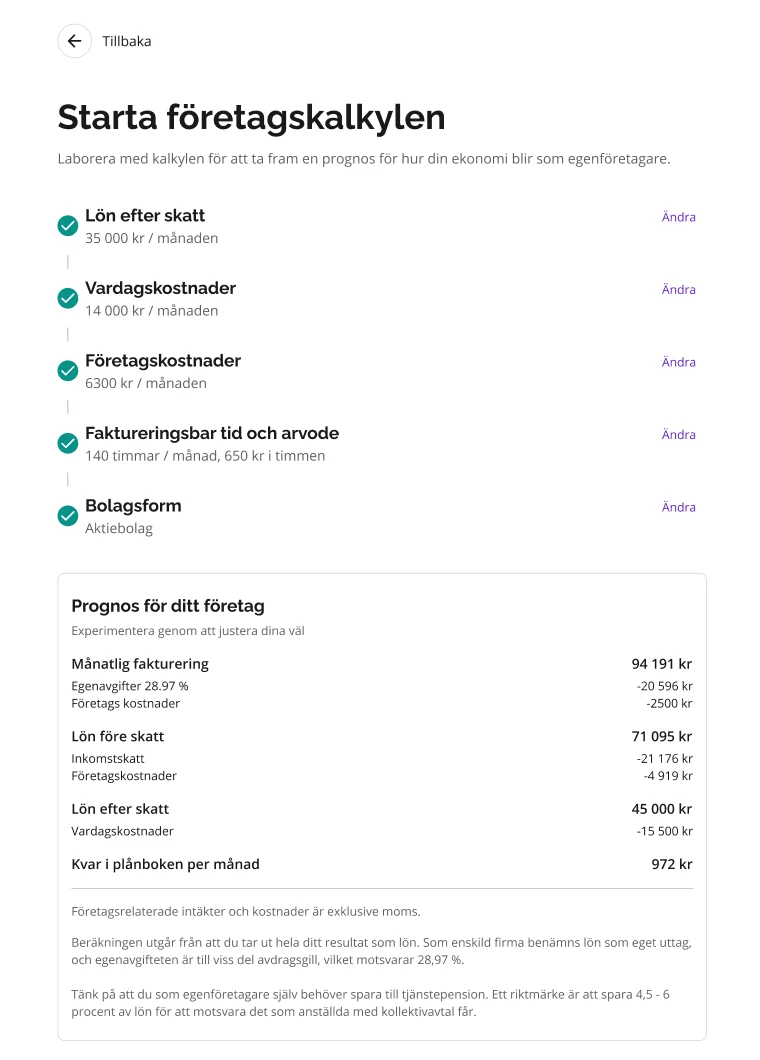
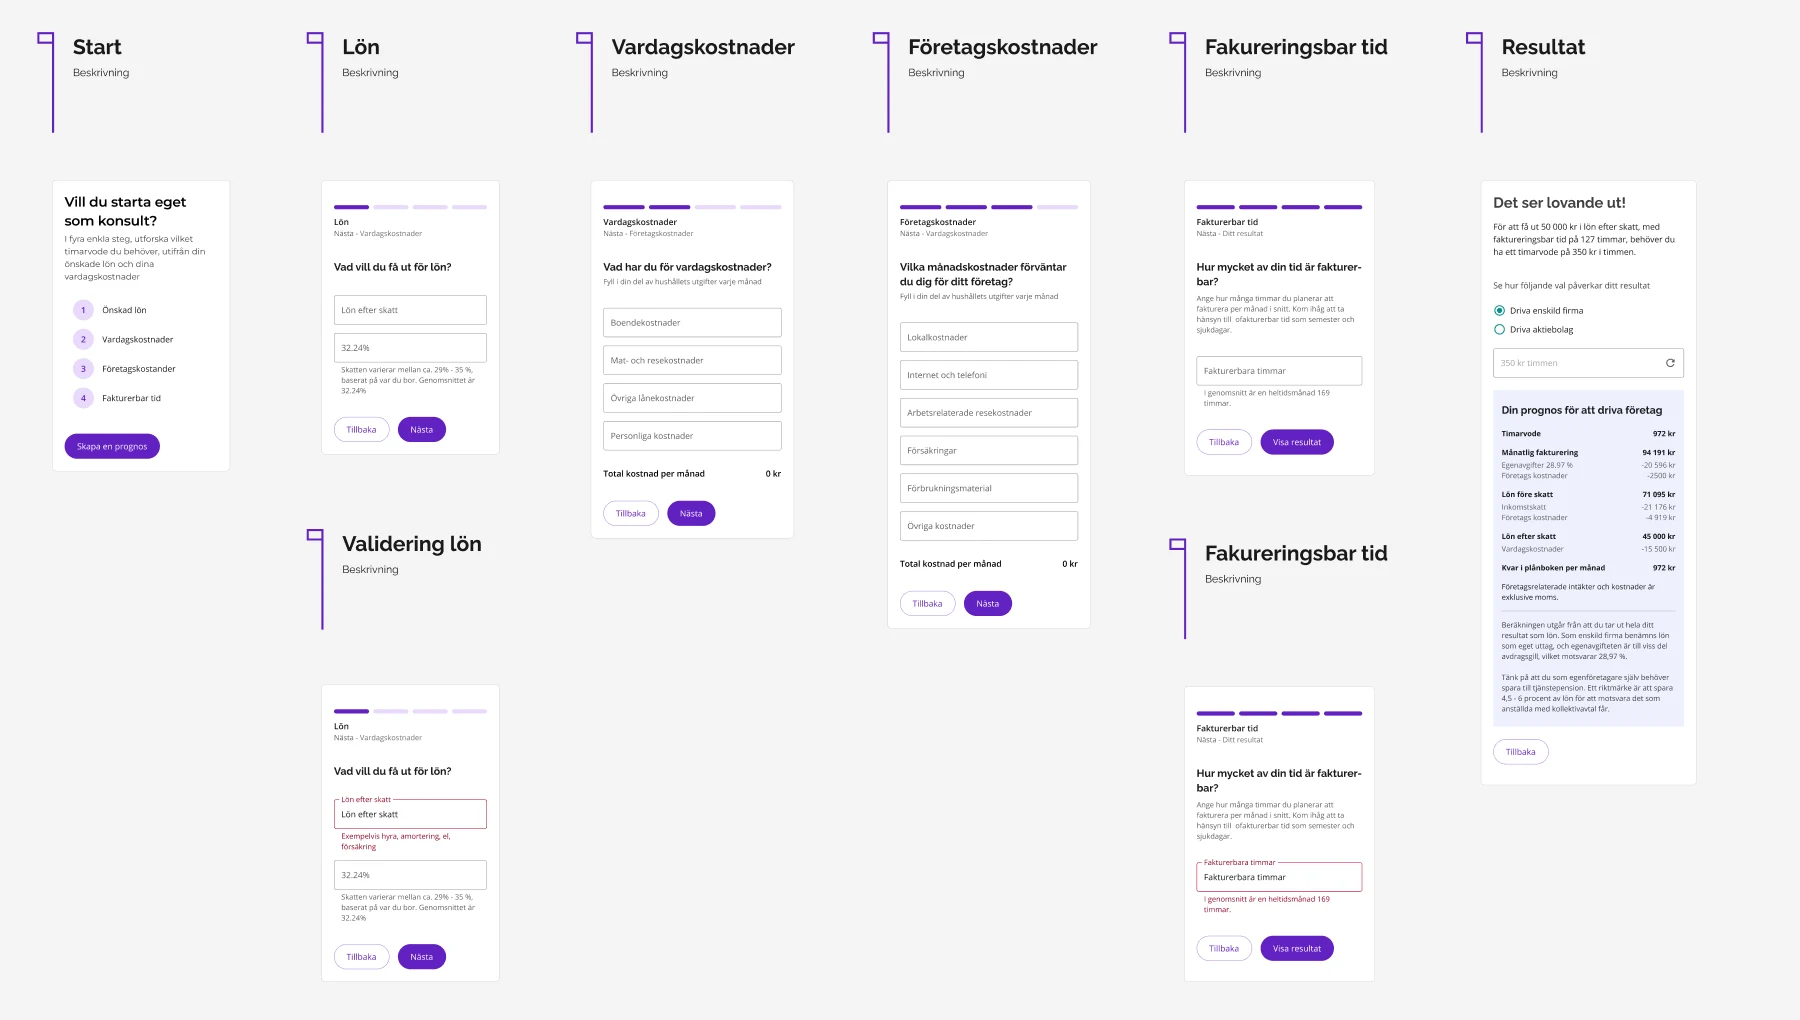
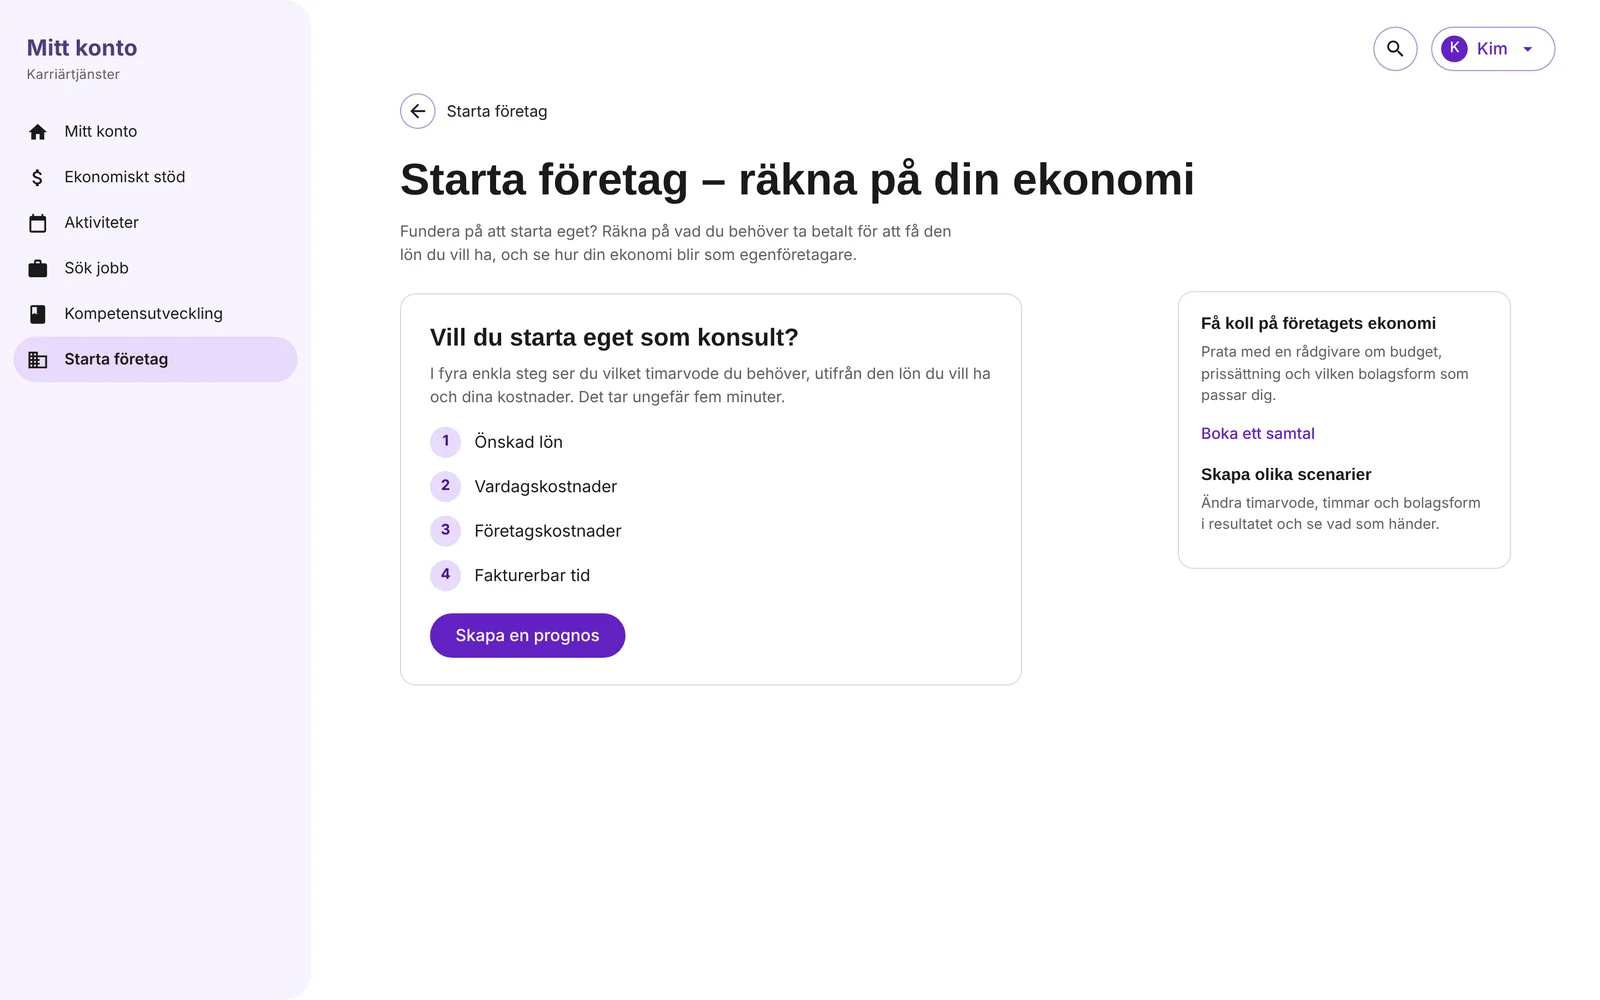
Four questions to an hourly rate
The working prototype shows the journey from desired income to an hourly rate and an adjustable forecast.
The journey consists of four questions. The seven numbered screenshots show selected parts of it, rather than every individual question.
Start with your own situation
Get the answer and explore further
The same journey on mobile
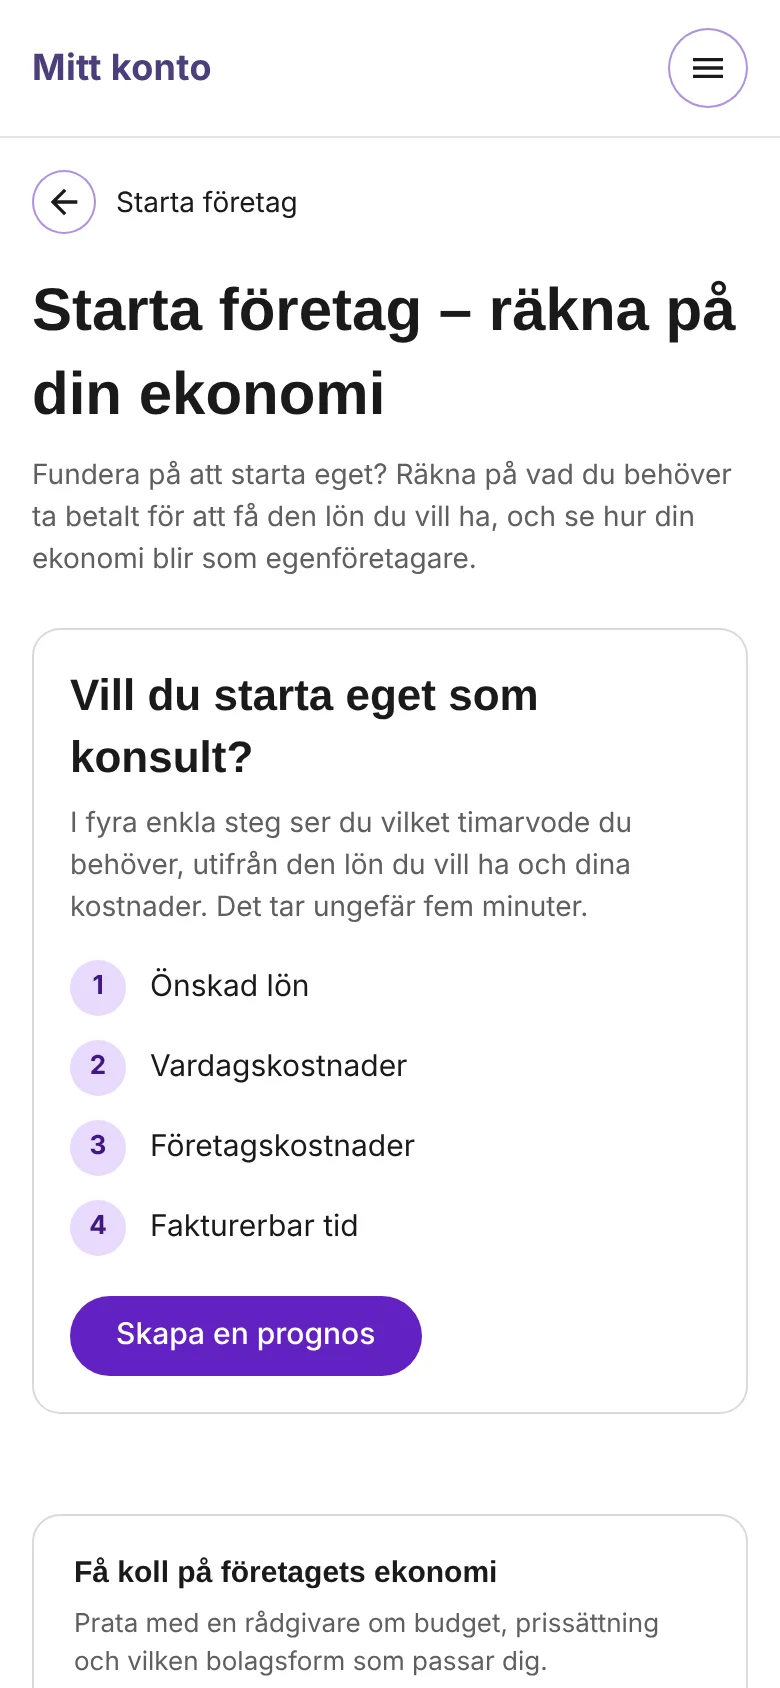
The three mobile images show the introduction, a question step and the result. Questions still appear one at a time on smaller screens, and the hourly rate remains the focus.
Try the calculator
The working prototype starts on the Starta företag collection page. From there, visitors can open the calculator, answer the questions, see the result and explore other scenarios.
The prototype is in Swedish and works on desktop and mobile.
A self-service tool that works in the details
Making the calculator understandable depended on language, feedback and the ability to change answers as well as the overall journey.
- Use the person’s language, not the accountant’sI chose phrases such as Lön efter skatt (Salary after tax) and Kvar i plånboken (Money left over). Formal accounting terms remain in the detailed calculation, where they help explain the figures.
- Give feedback as people enter informationExpense totals update immediately. The result also explains in words whether the income covers the costs. Colour reinforces the message but isn’t the only signal.
- Make changes without starting againThe result page shows previous answers, each with a link to edit it. Users can reopen a step, adjust their information and return to the updated calculation.
- Explain the assumptionsAmounts exclude VAT, the calculation assumes the full result is taken as salary, and users are reminded to save for their own pension. These explanations should be understandable without overwhelming the result.
- Built with TRR’s design systemI used fields, buttons, progress indicators and cards from TRR’s design system, keeping the experience familiar and giving developers existing components to build from.
The design outcome
I produced a digital business calculator that guides people through four questions, shows an hourly rate and lets them explore different financial scenarios.
The work progressed from sketches and alternative interaction patterns to development-ready designs and a working prototype for desktop and mobile.
The goal was to make the calculator usable without an advisor explaining the Excel spreadsheet. However, the source material doesn’t report usability tests or measurements showing how far that goal was achieved.
What I took with me
This project reminded me that a complex service doesn’t always need less information. Often, it needs a better order.
The Excel spreadsheet contained the necessary logic but presented it according to how the calculation was structured. Starting with the salary people wanted allowed me to design a journey around their own question.
I also took away that a good self-service tool doesn’t stop at giving an answer. It helps people understand the result, change their assumptions and explore the next question themselves.
For me, that’s the heart of the work: making something difficult understandable without removing what makes it valuable.